Data center management software with live progress analytics & insights
No one accountable for a data center program should spend every evening compiling a status report from four different systems. How far is the L4 testing? Will data hall 08 be ready for IT load tomorrow?
The dashboards in CxPlanner data center management software give every stakeholder live progress visibility across L1-L5 testing and all systems in one place. The Owner sees current phase readiness without requesting a report. The Cx team acts on what they see.
Book a demo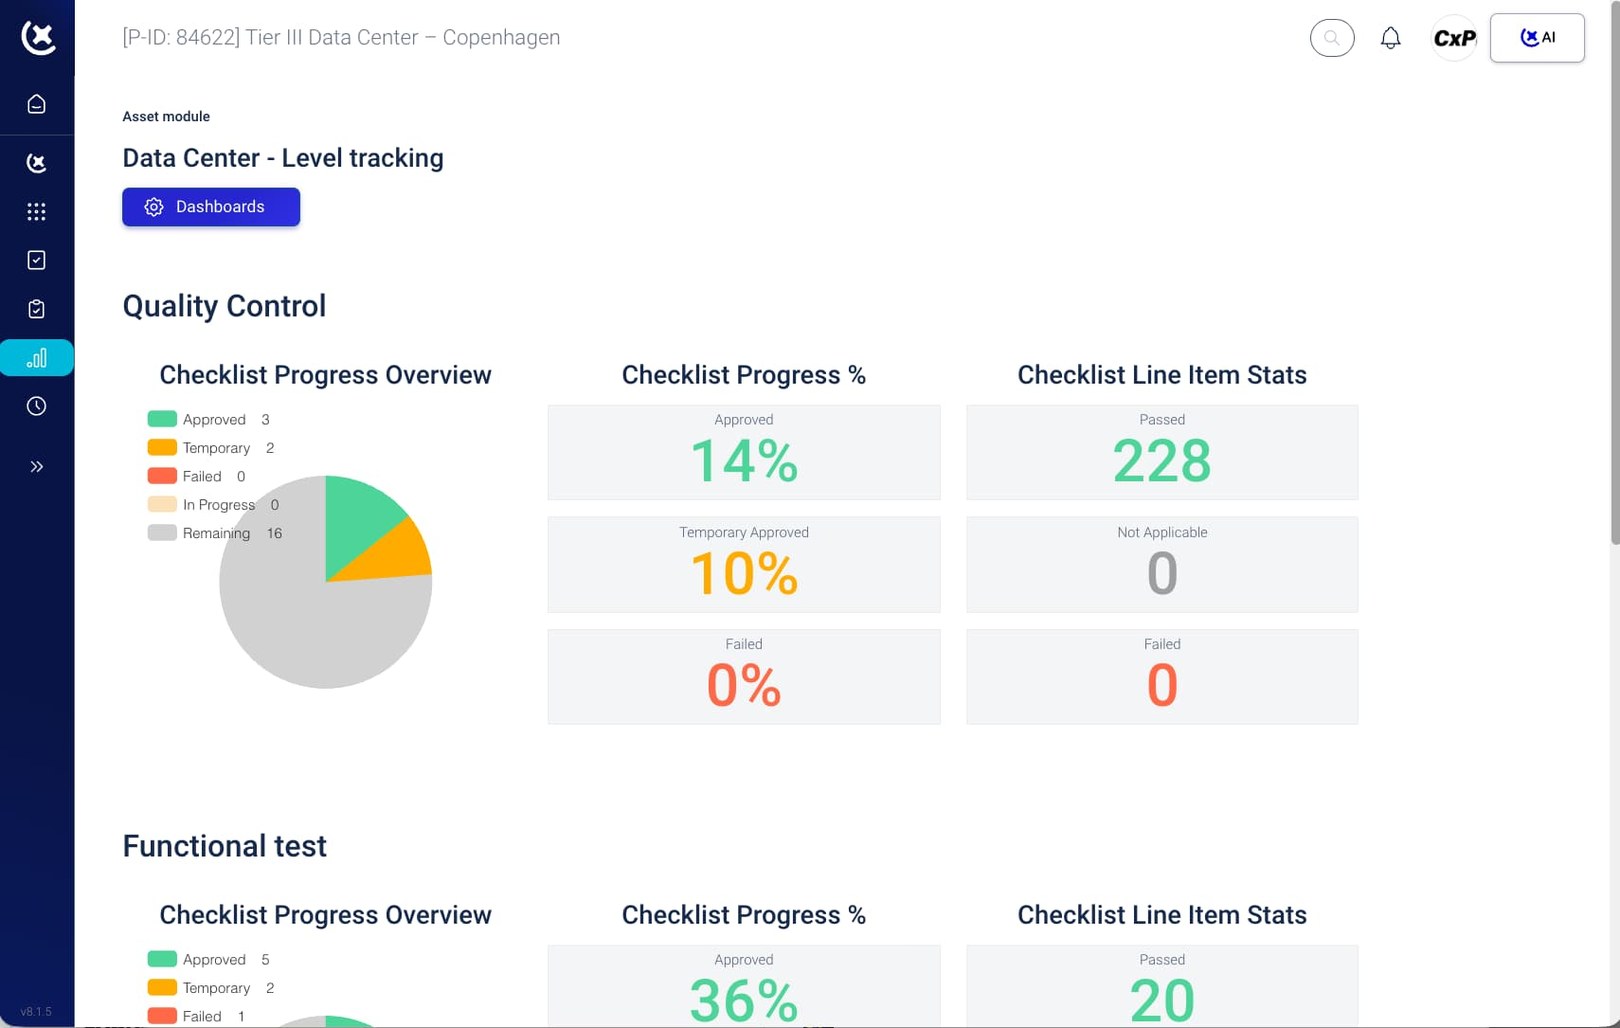
Keeping track of current status and reporting is a time-consuming job
Status on a data center build is difficult and time-consuming to produce. A live commissioning program involves hundreds of moving parts, thousands of individual assets, and delivery milestones that can't be changed.
Progress data is scattered across tools.
Test results in one system. Walkdown records in another. Subcontractor check-sheet status in email. The Cx team pulls from all three to build a picture that is outdated before it is finished.
Reports reflect last week, not today.
The weekly status report reaches the Owner on Friday. By Monday, three CRAC L3 tests have failed and one subcontractor is behind on an L2 for a handful of Rack PDUs. Data center management that operates on a weekly cycle cannot keep up.
Blockers are invisible until they are expensive.
A check-sheet overdue in one subcontractor's scope does not surface as a problem until it holds up an L4 gate review. The delay is already in the programme before anyone sees it.
Data center management software with live dashboards - updated directly from the field
CxPlanner is commissioning management software - designed for data center projects. The dashboards are built from the same data the field teams use to execute the work. When a subcontractor submits a check-sheet in data hall 9 or a test result is recorded on site for the CRAH, the dashboard updates. The Owner, CxAuthority, and GC see the current programme.
Here's how it works:
Subcontractors submit on site
Check-sheets and test results are submitted directly in CxPlanner - and received in real time.
Dashboard updates immediately
No sync step, no import. The data center management software dashboard reflects the submission the moment it lands.
Blockers flagged automatically
Overdue items, failed tests, and gate blockers surface in the dashboard without anyone having to look for them.
Every stakeholder sees live data
The Owner tracks phase readiness, the CxAuthority monitors completion rates by level and scope, the GC tracks gate sign-off status by system - all from the same live view.
CxAI drafts the status report
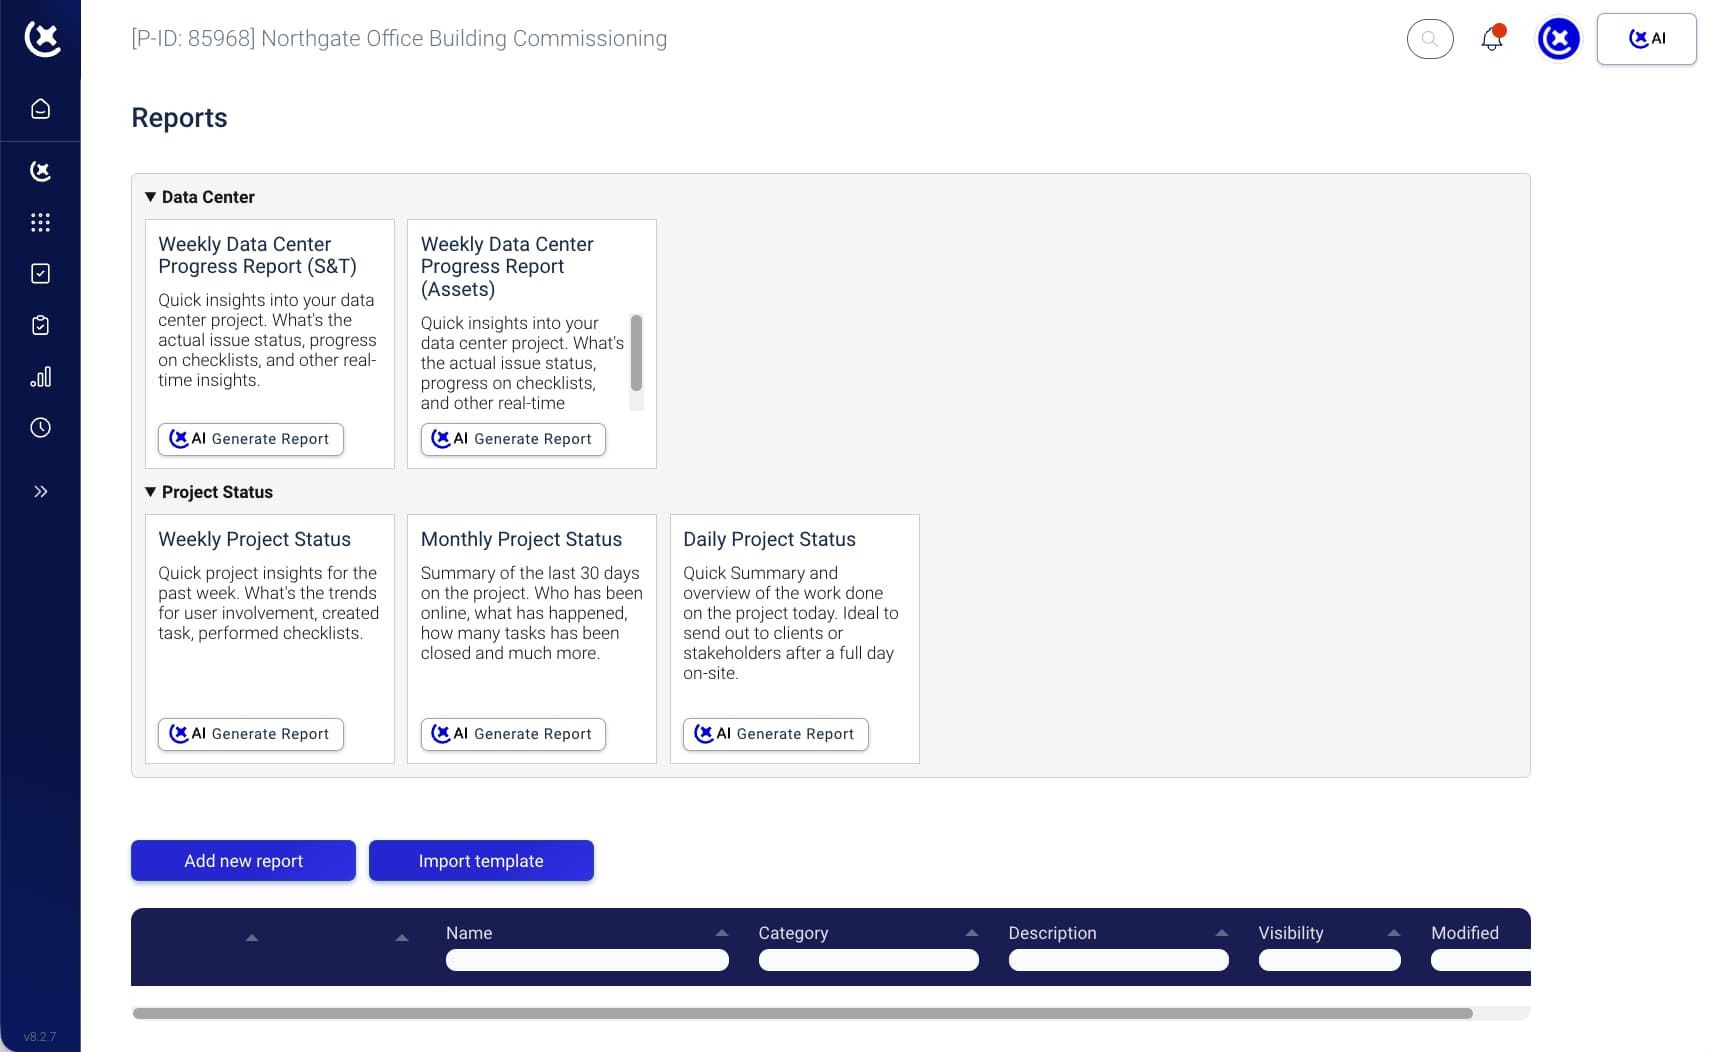
Ask CxAI to generate a weekly summary or list overdue L3 items. The CxAI drafts it from live data - the team reviews and sends.
The capabilities that power each step of the dashboard workflow are below.
What the data center management software covers on a project
Live progress data - across every Level, every system, every subcontractor scope.
Real-time L1-L5 progress dashboards
Progress across all five Levels in one view. The percentage completion flows up from the single CRAH and into the Datahall and into the Sub-system and finally up to the System. Filter by level, system, or subcontractor scope. CxPlanner data center management software reflects what is signed off, what is in progress, and what is blocked.
Planned vs Budget
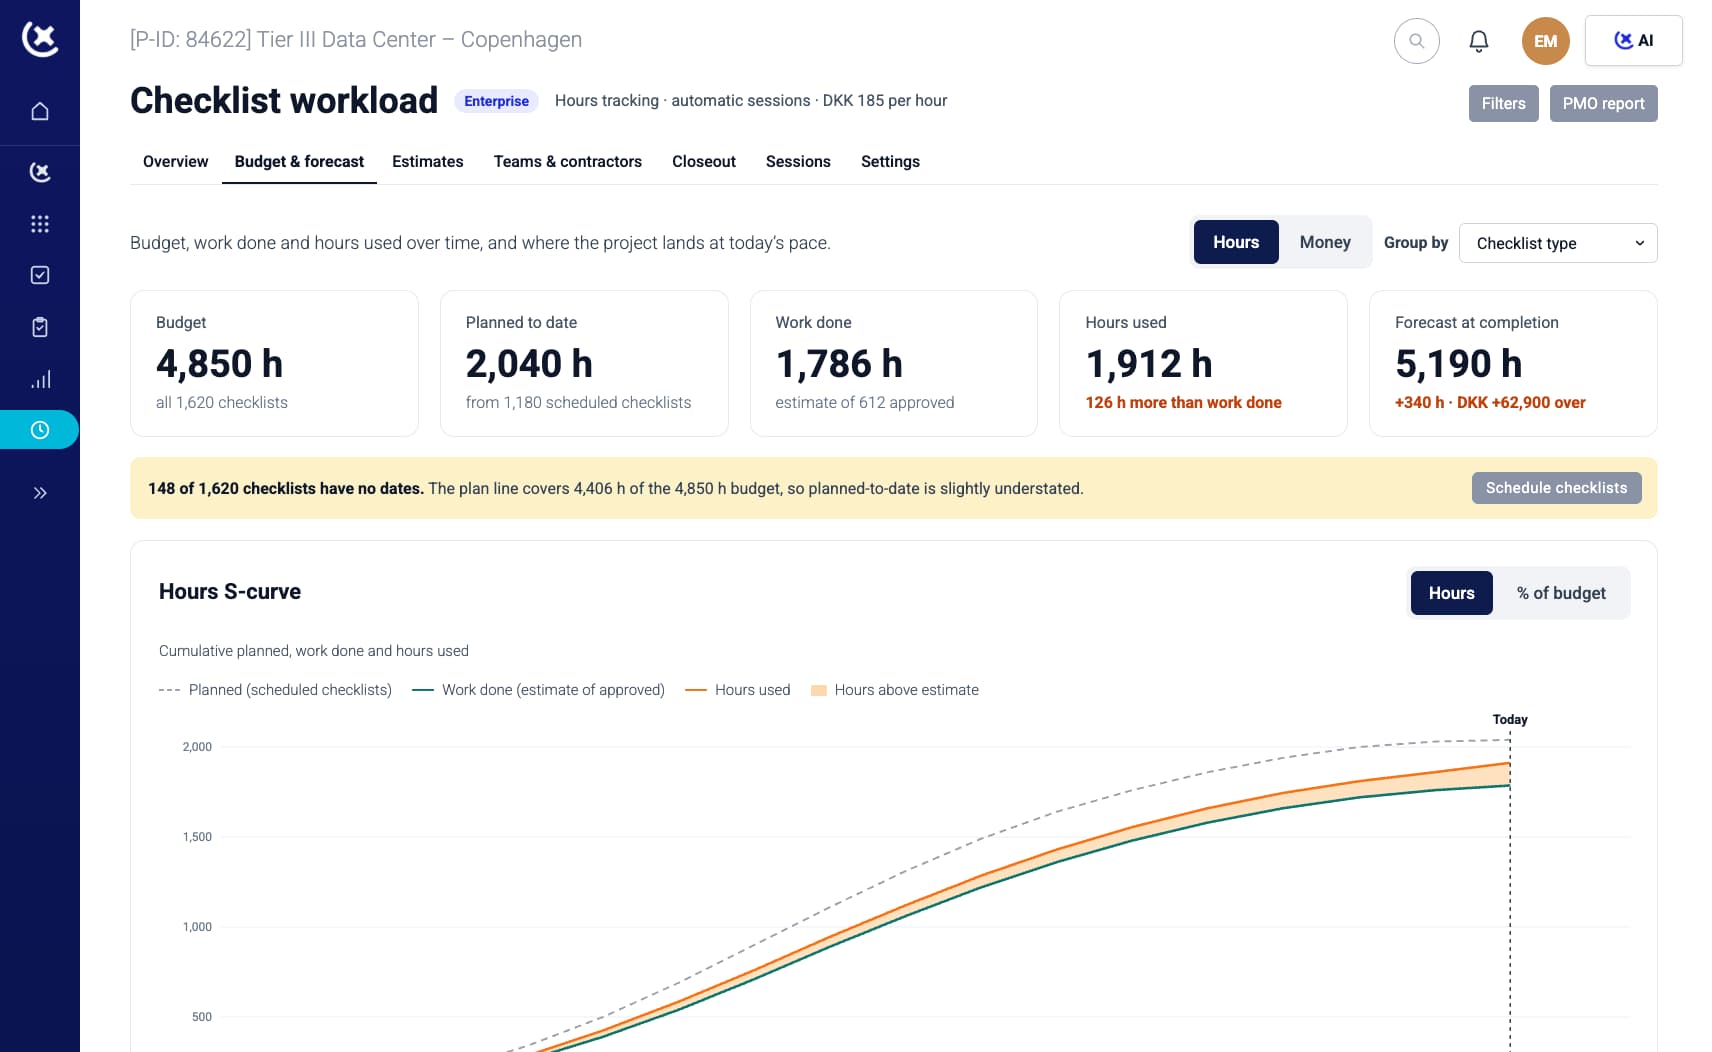
Did you plan on using 2,500 hours spread out across 1,100 checklists for the next 6 months? Keep live tracking of the actual usage - will this project be profitable? If not, make the adjustments as you move forward.
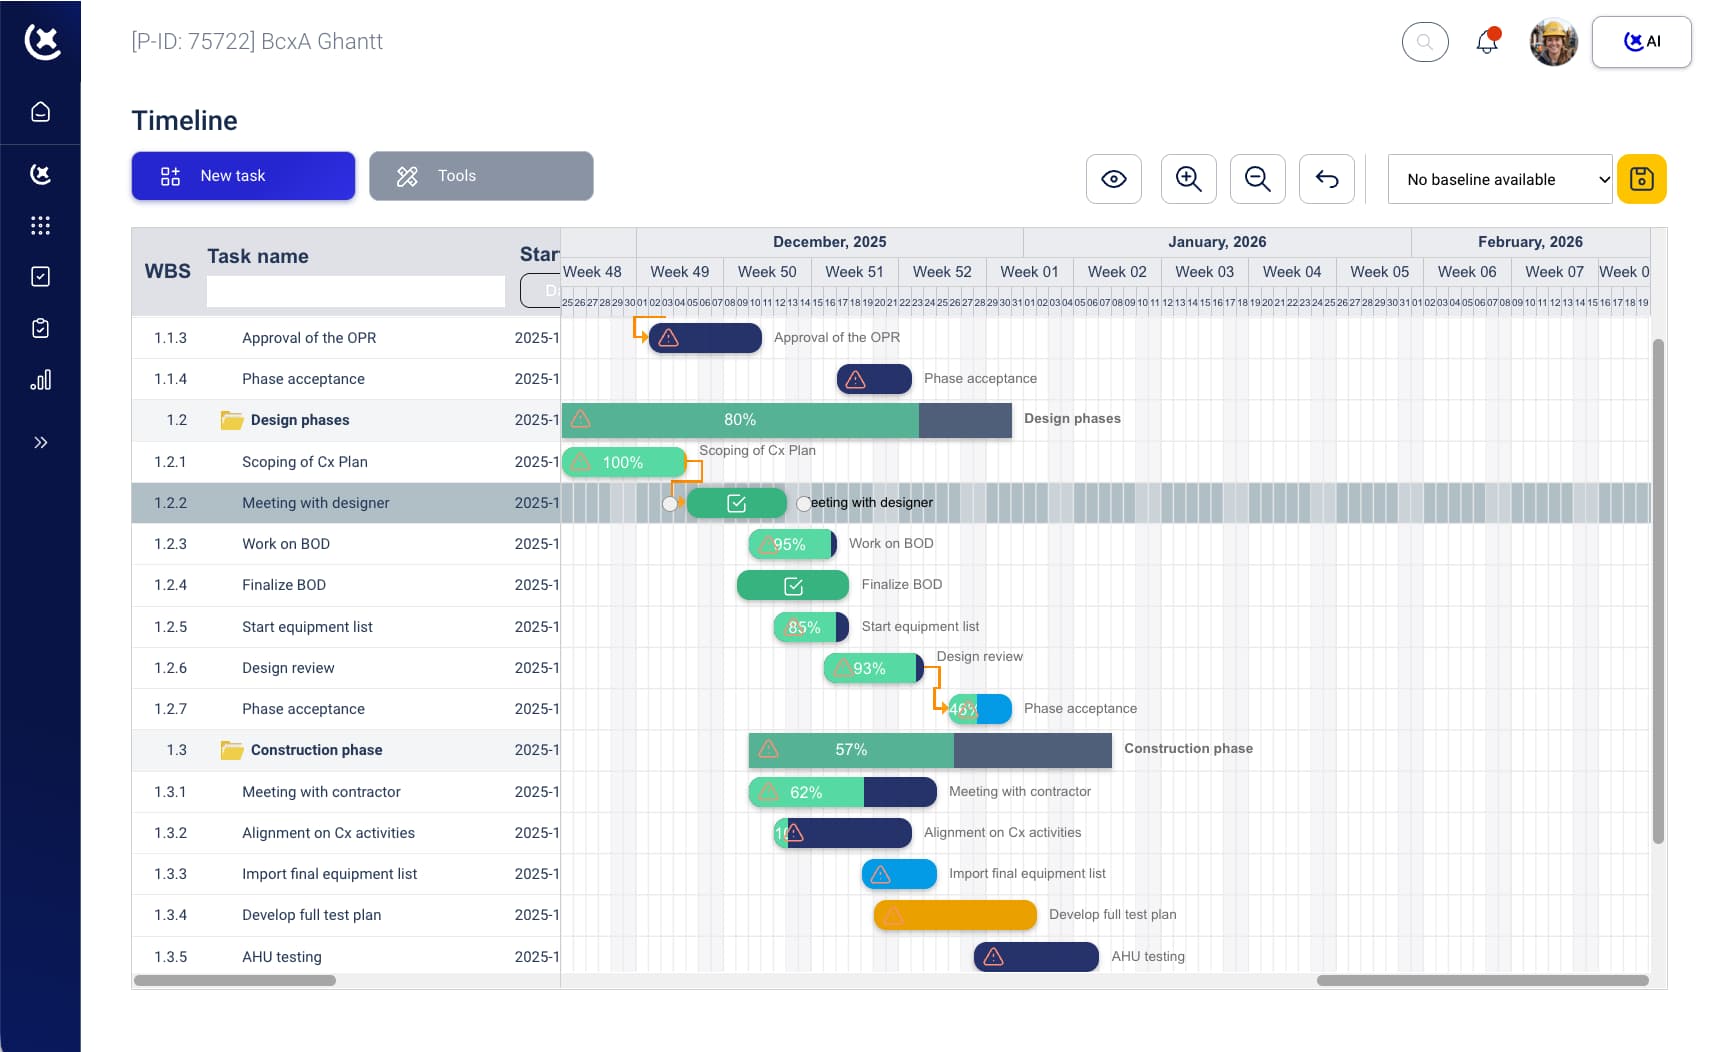
Subcontractor scope visibility
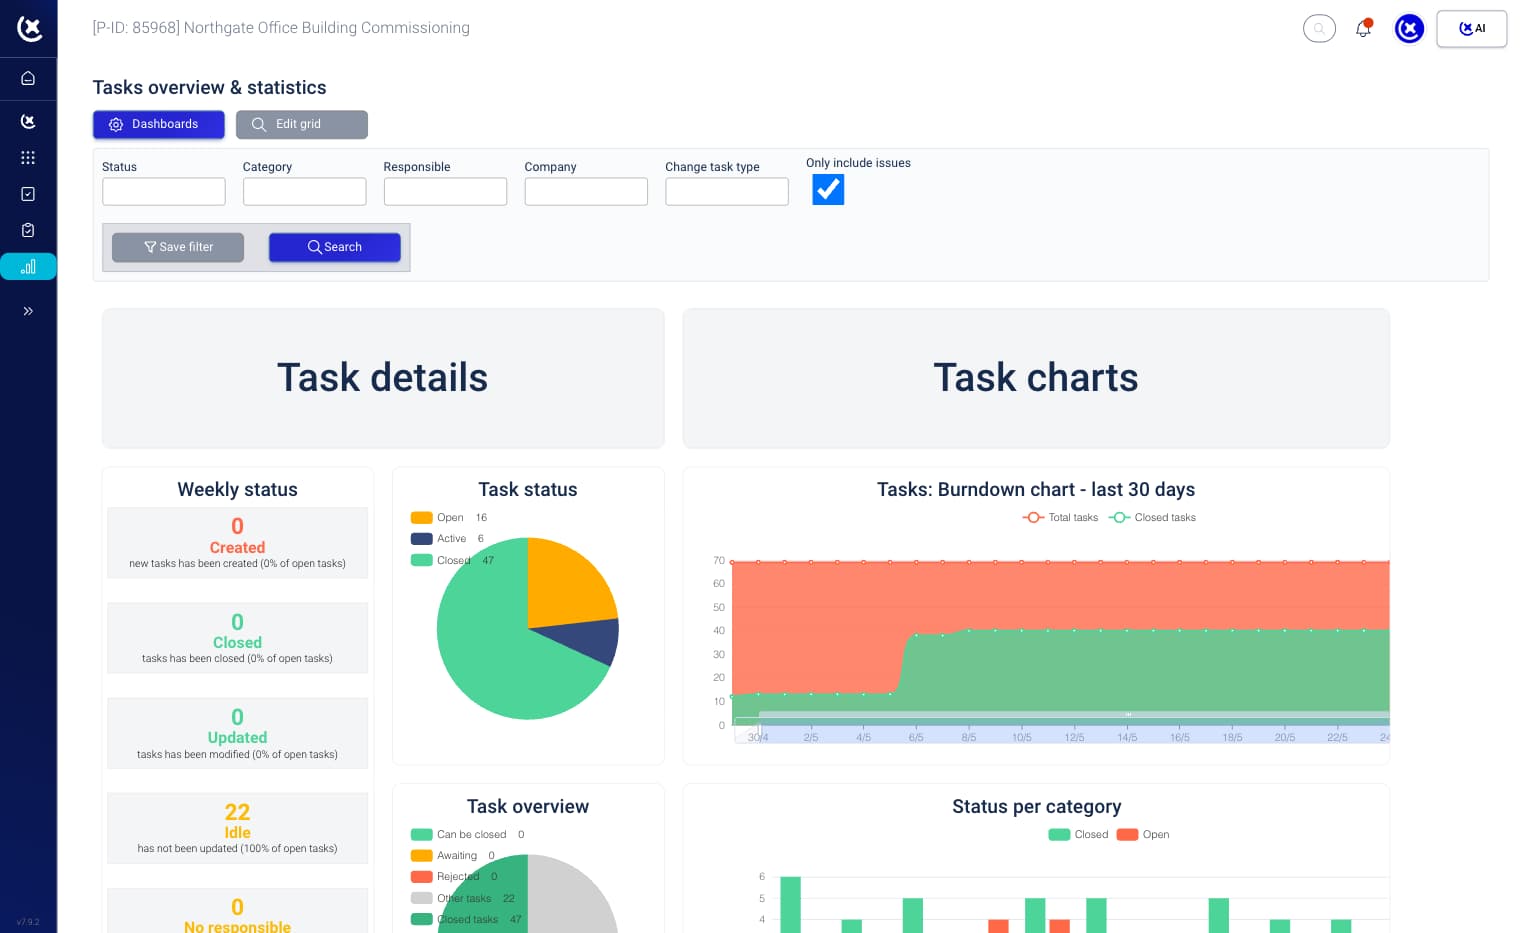
Electrical and mechanical subcontractor progress visible side by side. The CxAuthority sees current completion rates across all scopes without pulling a report from each subcontractor.
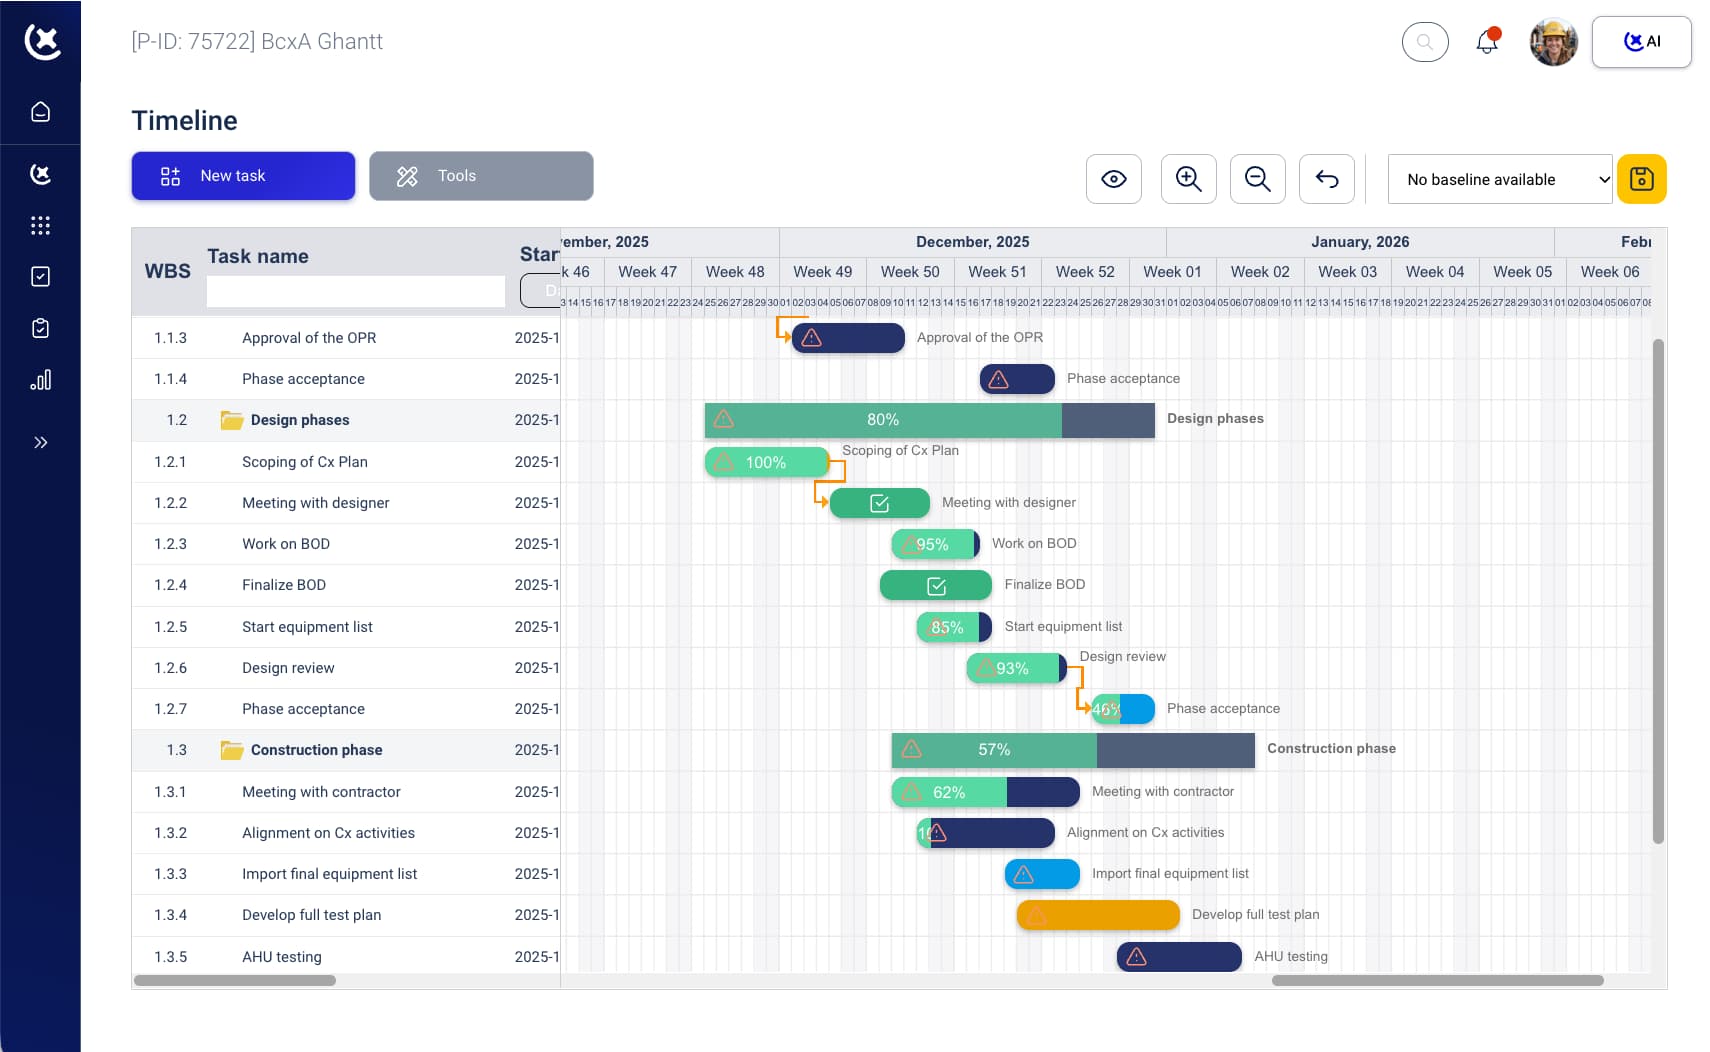
Automatic blocker and overdue item surfacing
Overdue check-sheets, failed tests, and gate blockers appear automatically. CxPlanner flags the issue before it costs a gate delay.
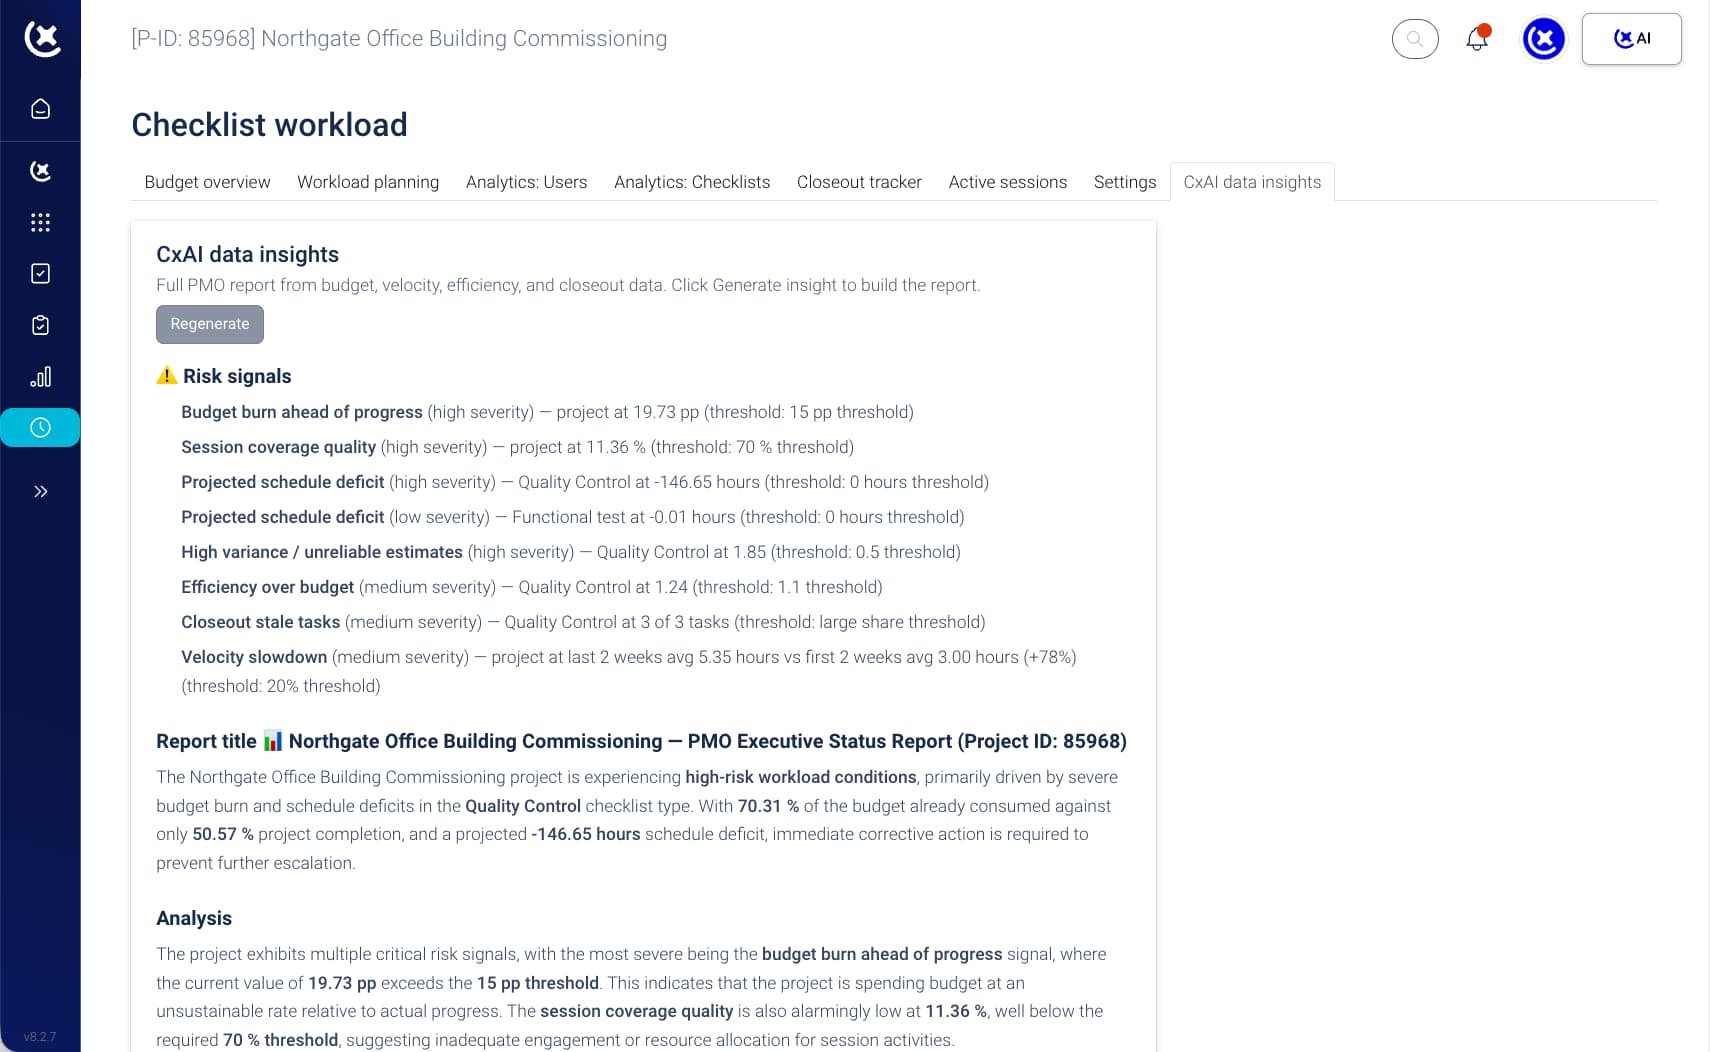
CxAI-assisted status reporting
Ask CxAI in plain language - generate a weekly status report, list all overdue L3 items, show which scopes are behind. CxAI drafts the report from live data.
Key benefits from when data center progress visibility is live and current
The Cx team recovers the time spent building the picture manually. The Owner gets delivery milestone visibility without requesting a report.
The Friday afternoon report is already done.
Live dashboards mean the status report compiles itself. CxAI drafts the narrative from current data. The Cx lead reviews and sends.
Blockers caught the day they appear.
An overdue L2 check-sheet that would have held up the L3 gate sequence surfaces in the dashboard the same day it is overdue.
One picture for all stakeholders.
Owner, project director, Cx lead, and subcontractors all look at the same data center operations software view. No conflicting reports, no status call to align everyone before the meeting.
See what a live data center dashboard looks like
If your Cx team is still compiling status from multiple systems on a weekly cycle, the gap between report and reality is already in your programme. Book a walkthrough - we will show you what the dashboard looks like on a live project.
Request a walkthroughCommon questions about CxPlanner data center dashboards
Does the dashboard show all five Levels in one view?
Yes. Progress across all five testing levels is visible in one dashboard - by level, by system, or by subcontractor scope. The data center operations software lets you filter to a specific gate stage or see the full programme at once.
Can project owners access the dashboard directly?
Yes. Owners and clients can be given direct access to the dashboard - so they see the same live progress the CxAuthority sees, without waiting for a weekly report.
How does CxAI help with status reporting?
Ask CxAI in plain language - generate a weekly status report, list overdue L3 items, show which subcontractor scopes are behind. CxAI drafts the report from live data.
Does the dashboard update in real time?
Yes. When a subcontractor submits a check-sheet or a test result is recorded on site, the data center operations software dashboard updates immediately - not on a weekly reporting cycle.