Turn your schedule into a clear visual timeline with skyline charts
Skyline charts give you a structured view of every task, system, and milestone across the project. See how work stacks, overlaps, and progresses over time.
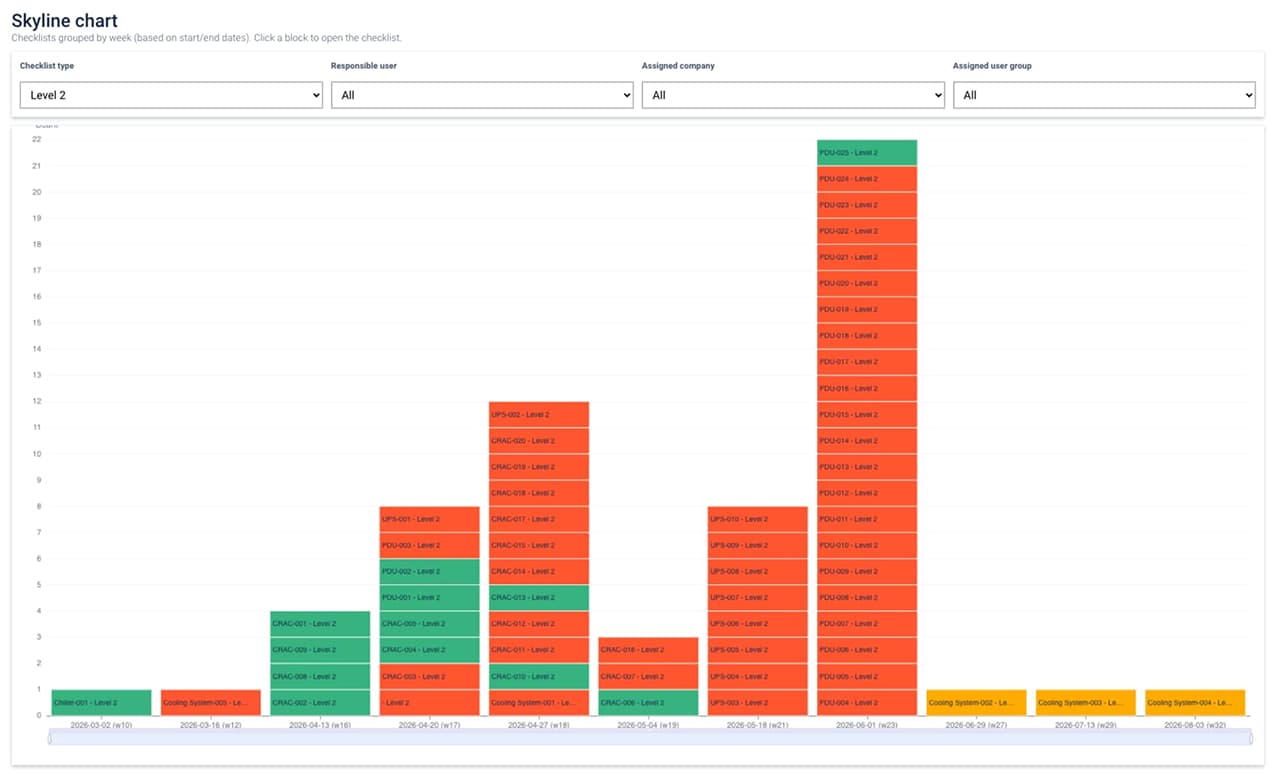

Understand the timeline at a glance
Instant visual overview
See weeks of work across systems in one clean, structured view.
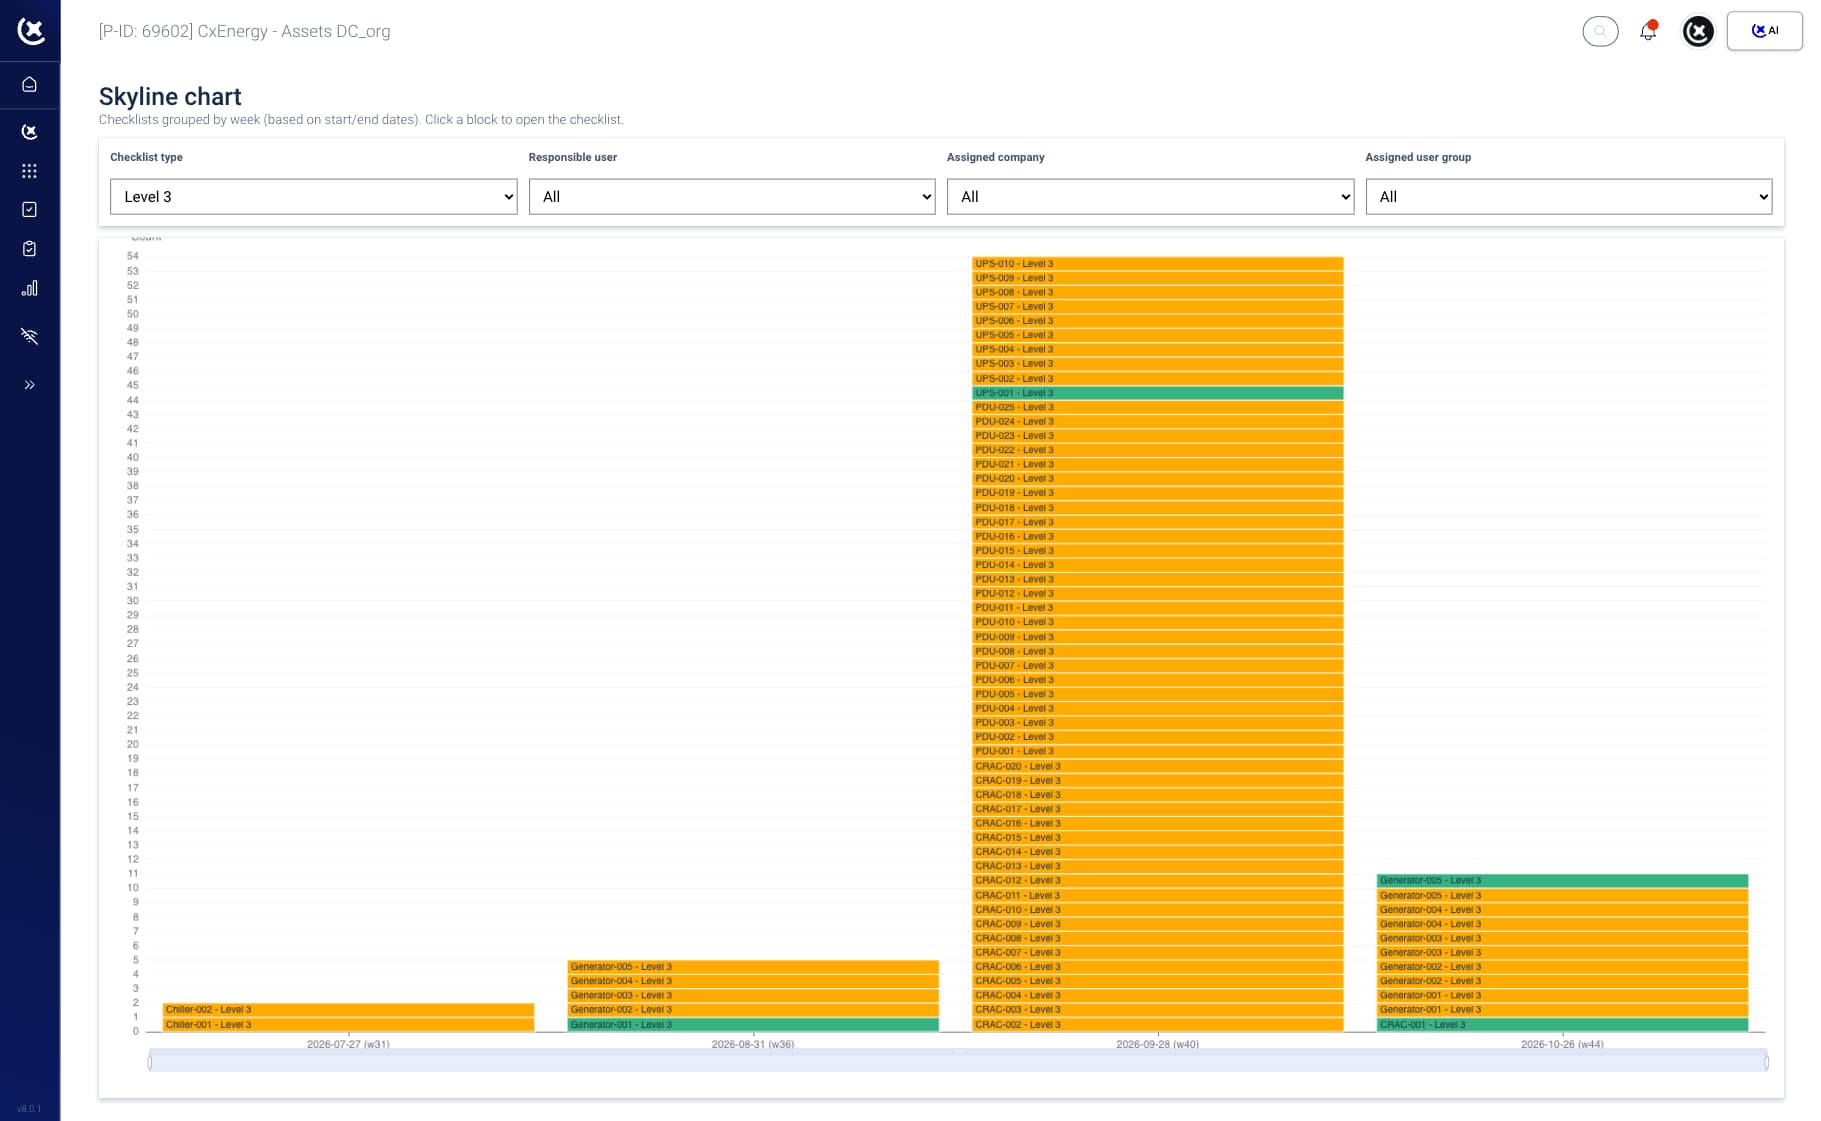
Spot risk early
Identify bottlenecks, overload, and sequencing issues before they impact delivery.
Align every team
Give everyone the same view of progress, priorities, and upcoming work.
Track progress
See how work actually unfolds
Skyline charts show the real shape of your project timeline.
Not just what’s planned, but how execution is progressing across systems and teams.
Quickly answer:
- What’s happening this week
- What’s falling behind
- Where teams are colliding
From complexity to clarity
When hundreds of tasks run in parallel, structure is everything. Skyline charts turn scattered schedules into one coherent timeline.
Explore the featureTrack progress
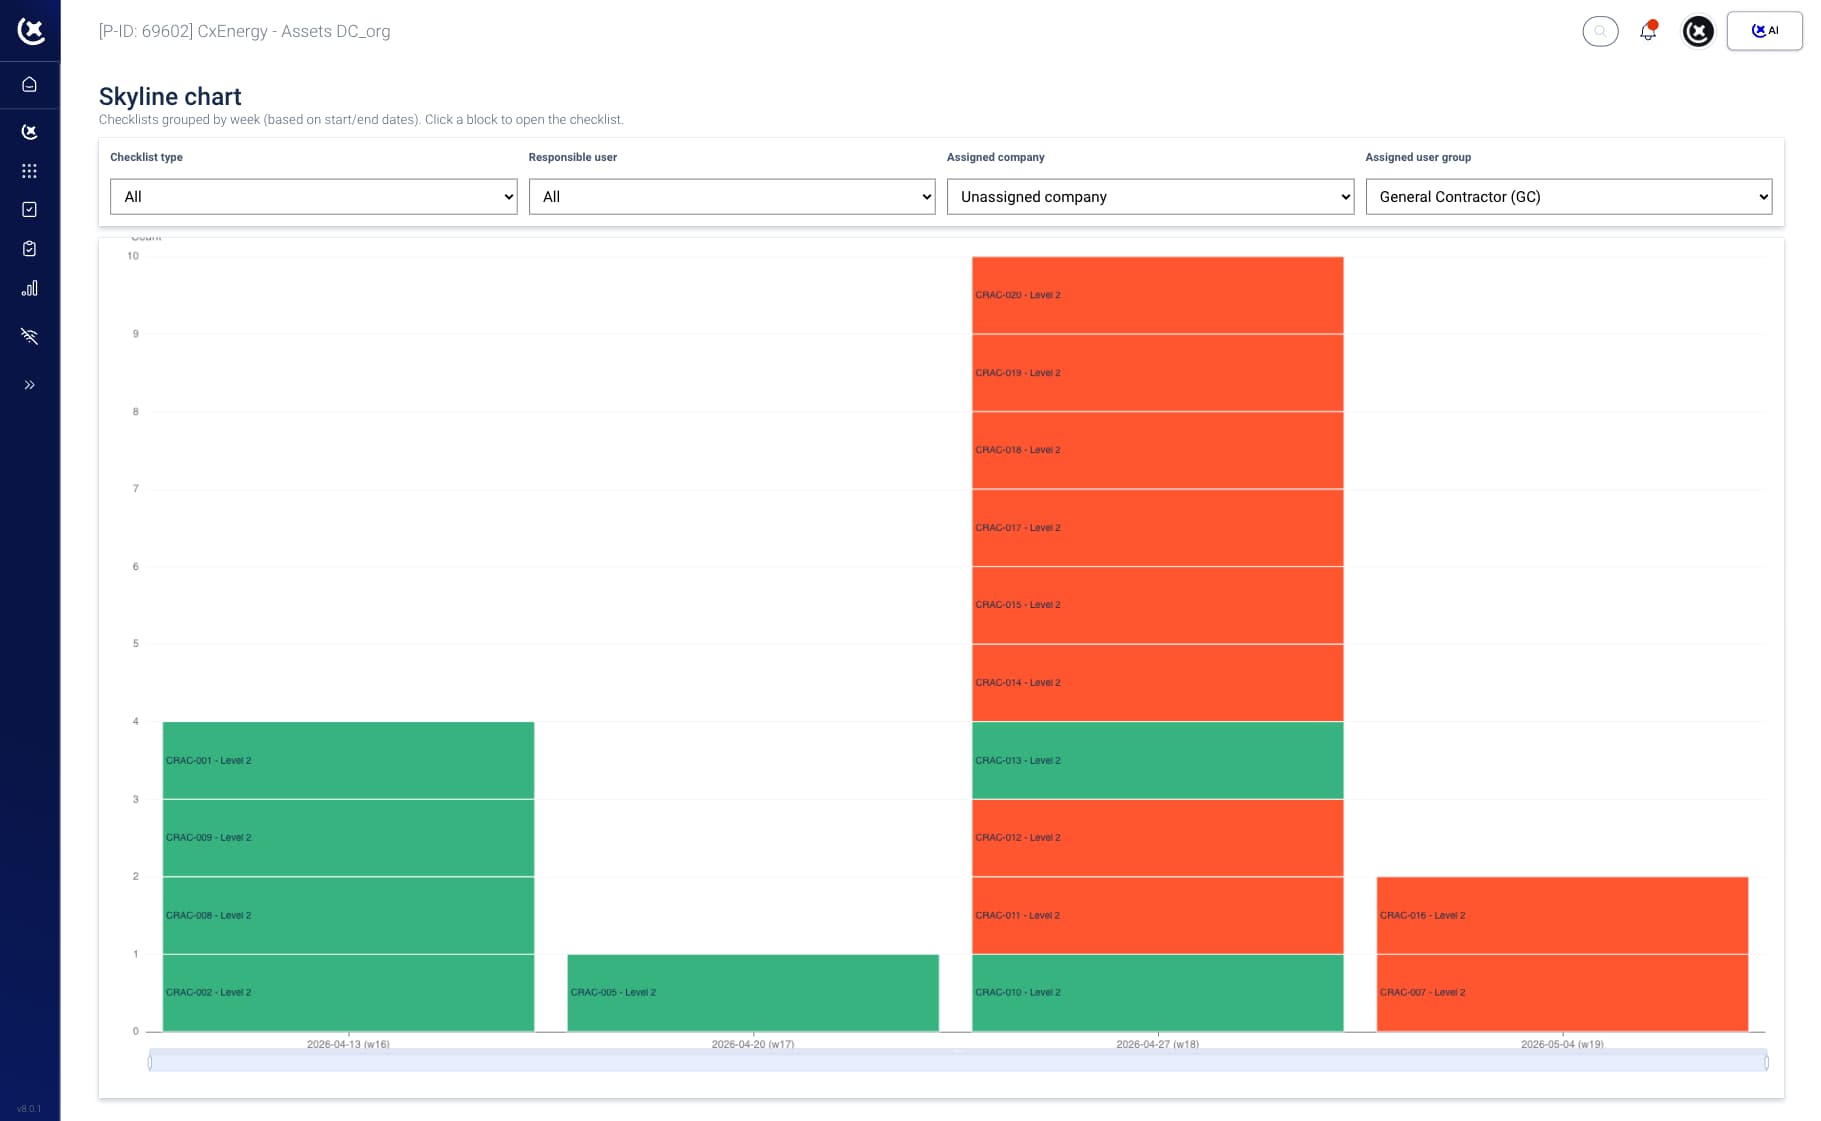
Know when systems are truly ready
Completion isn’t about ticking boxes. It’s about sequence, dependencies, and timing.
Skyline charts help you verify that work is completed in the right order, so handover happens without surprises.
Zoom in without losing context
Start with the big picture. Drill into any task when you need detail.
Open checklists, review status, and validate progress, all from the same view.
“We stopped guessing where we stood. Now we can see it.”
Skyline charts give teams a shared understanding of progress across the entire project timeline.
Clear visibility. Better decisions. Faster execution.
- Thomas T. Jarloev
Founder & CEO of CxPlanner, QCxP, CxM, CxA
15+ years in commissioning · CxAP · CxM · QCxP · First in the EU to hold both CxM and CxAP · Author of commissioning books + guidelines
Curious to see CxPlanner in action?
Book a demo with Thomas